
- Solve real problems with our hands-on interface
- Progress from basic puts and calls to advanced strategies
Interactive Options Course
Lesson 1 of 17
When users log in to IBKR Desktop, by default they will see the Positions tab within the Portfolio.
By selecting an instrument, a basic thumbnail chart displays in the panel to the right.
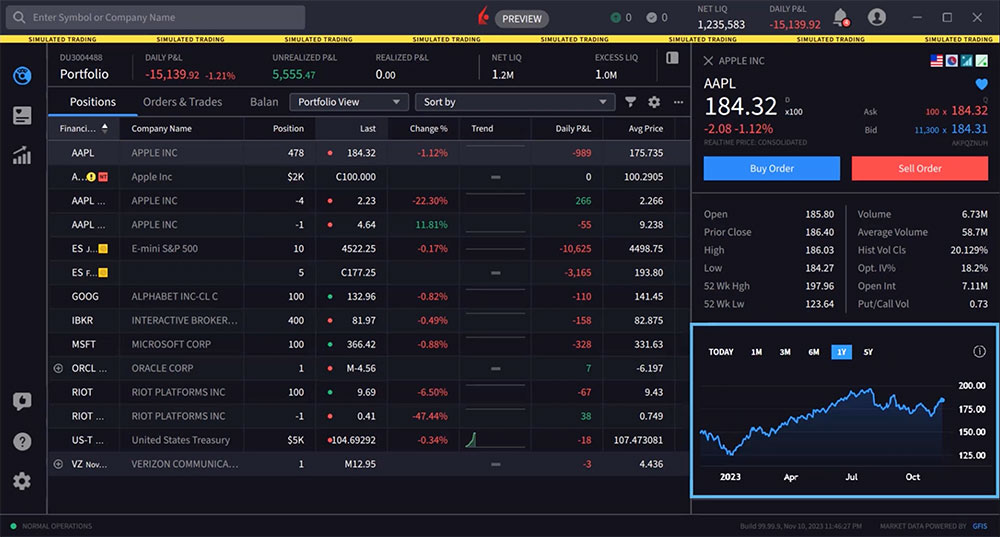
However, users may launch a full-size chart area by either double-clicking on a symbol or by clicking the Quote icon in the left panel.
The Quote Panel is comprised of two panels. By default, the Quote panel opens with the Charts tab selected. Users may also access Option Chains within the Quote panel by clicking on the tab above.
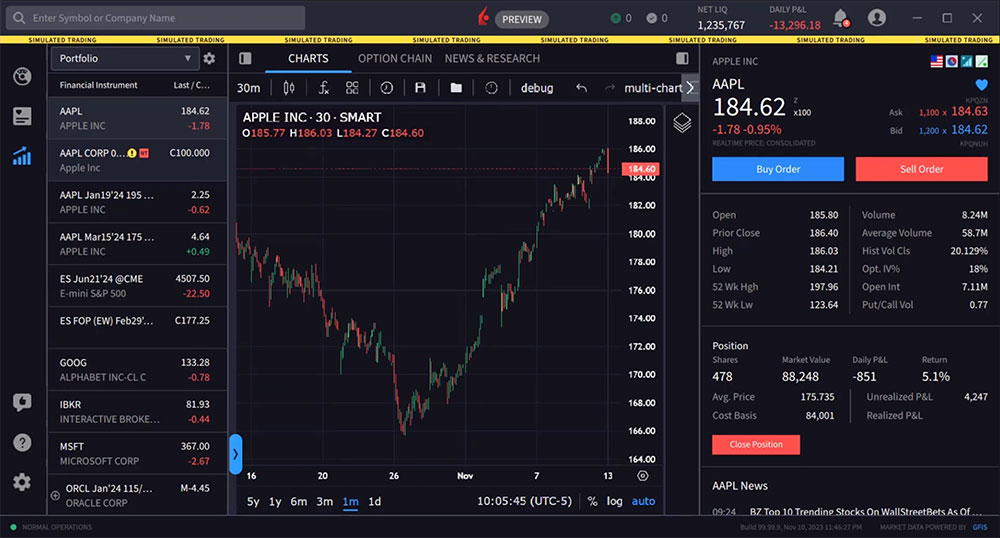
To change the symbol in your chart, select an asset from the Financial Instrument section of the Quote panel.
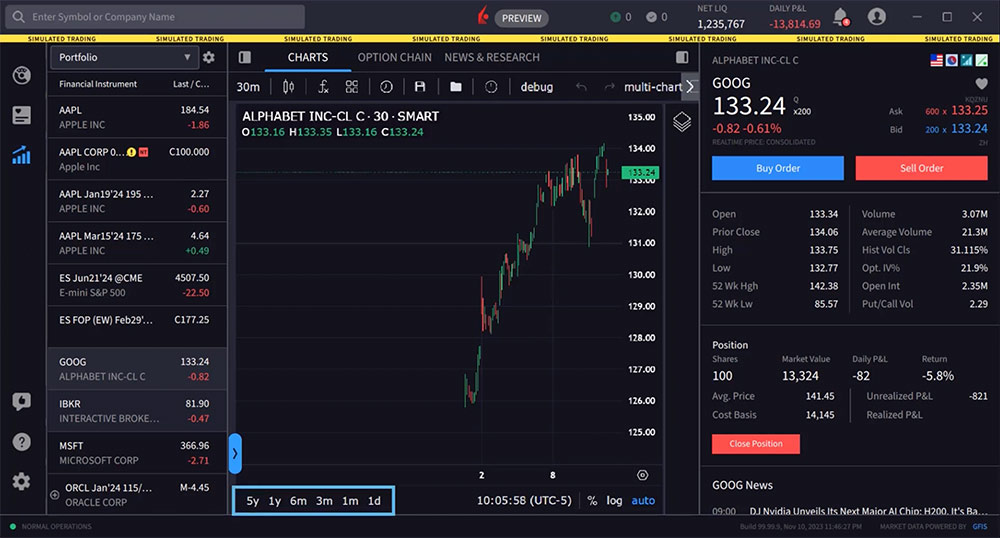
The user can change the time period displayed from the lower left of the chart by clicking on any of the desired time period buttons.
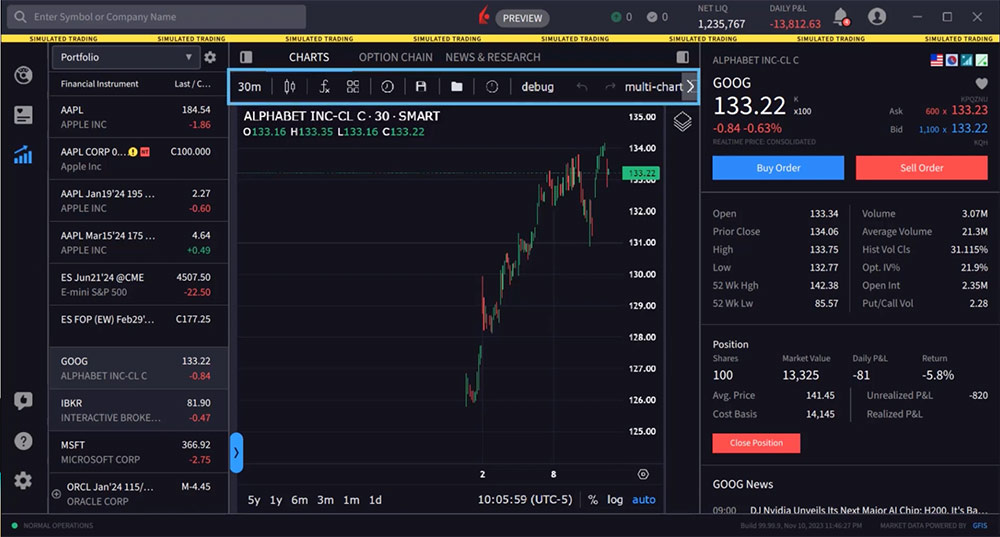
Using the icons along the top of the chart, the user may change the periodicity of the chart display from intraday to daily, weekly etc. For example, let’s choose a symbol and set the display to 1y below the chart. Now, let’s use the icon to the upper left to switch from Day to Week.
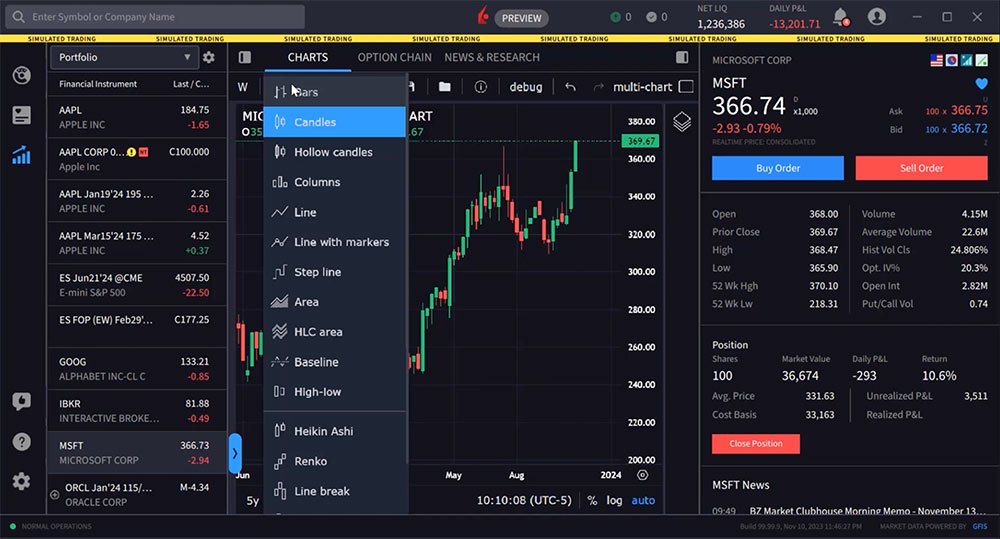
To the right, user may choose from the icon an array of different chart types, from candles, lines, high-low, Heikin Ashi and Point & Figure charts.
Click the indicators icon to display a list of available studies to add to the display. The user may scroll down the list or enter a search term. In this case user is looking for ‘moving average’ and starts to type in the input field. Click the desired indicator to add immediately to the chart. By hovering above the study data beneath the ticker symbol, floating icons appear to the right of the added study and user may hide, see settings or delete the study. In this case user selects settings and can adjust the study inputs to change the settings and click ‘ok’.

Once the user has added a series of indicators to a chart, it may be saved as an indicator template by tapping the four-squares icon and entering a name followed by ‘save’. Saved templates may be accessed by clicking this icon later.
They can also save applied indicators as a template, show or hide Outside Regular Trading Hours data, and save the current chart as a snapshot.
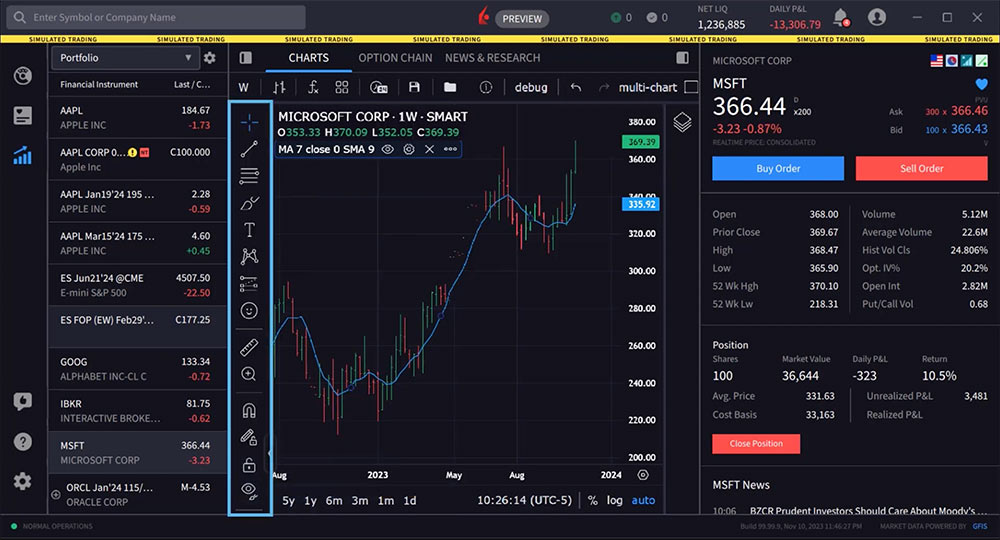
Drawing tools are concealed behind a blue arrow along the lower left edge of the chart. Click that to expand the drawing tools panel. Here the user may click an icon to use a drawing tool. When active, the tool icon is blue. Here, at the top of the icon set, the user can click on or off the chart crosshairs. Use the tools to draw Fibonacci Retracement, Trend Lines and more. Hold your mouse over an icon to see the extended tool menu when applicable. To remove drawings and indicators from the display, the user would right click on a trend or Fibonacci line and select ‘remove’.
You can increase the size of your chart by hiding the left and right-side panels. Note the Show/Hide panel icons to the upper right and left of the chart. Simply click one or both of these Show/Hide Panel icons to maximize the display.
Note that if the user hides the left panel, which includes the Financial Instruments, they will not be able to change the symbol in the chart. The left side panel must be reopened to select a symbol.
The user may view multiple charts using multi-chart mode. The multi-chart icon is labelled to the upper right of the display. Click the multi-chart icon to reveal layout choices for up to eight styles.
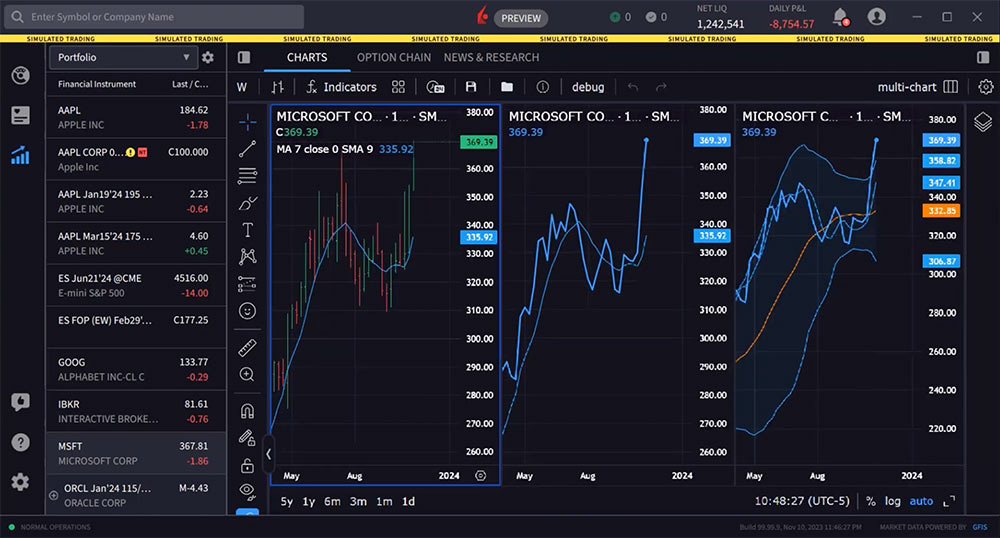
The user may display multiple charts that use the same symbol in each panel by activating Sync in Layout – Symbol. You can also sync up the charts’ interval, crosshair, and time period.
Alternatively, show multiple charts with different symbols by disabling Sync in Layout.
Load different symbols in your charts by selecting a chart and then clicking an asset in the Financial Instrument section.
Finally, click the gear icon on the top right above the chart for customization options, such as changing colors, labels, background, gridlines and more.
Resources
For specific platform feedback and suggestions, please submit it directly to our team using these instructions.
If you have an account-specific question or concern, please reach out to Client Services.
We encourage you to look through our FAQs before posting. Your question may already be covered!
The analysis in this material is provided for information only and is not and should not be construed as an offer to sell or the solicitation of an offer to buy any security. To the extent that this material discusses general market activity, industry or sector trends or other broad-based economic or political conditions, it should not be construed as research or investment advice. To the extent that it includes references to specific securities, commodities, currencies, or other instruments, those references do not constitute a recommendation by IBKR to buy, sell or hold such investments. This material does not and is not intended to take into account the particular financial conditions, investment objectives or requirements of individual customers. Before acting on this material, you should consider whether it is suitable for your particular circumstances and, as necessary, seek professional advice.
The views and opinions expressed herein are those of the author and do not necessarily reflect the views of Interactive Brokers, its affiliates, or its employees.
Any stock, options or futures symbols displayed are for illustrative purposes only and are not intended to portray recommendations.


The lesson is good
Thanks for tuning in!
el video esta en ingles, hay videos en español?
Hola, gracias por contactarnos. Sí, tenemos cursos de Traders’ Academy disponibles en español. Pase el cursor sobre “Cursos” a la izquierda y haga clic en “Español (LatAM)”. ¡Esperamos que esto le resulte útil!
Are ratio charts available and if so are there alerts on them ?
Hello, thank you for reaching out. Ratio charts are available in TWS Mosaic. You can find them by right clicking the chart and clicking Virtual Security. Please view this FAQ with instructions to set up alerts with Charts in Trader Workstation: https://www.ibkr.com/faq?id=27279175
We hope this helps!
excellent to get familiar with the system.
Thanks for engaging!
Way simpler than TWS to understand and operate.
We appreciate your feedback.
Thank you. I learnt a lot in my first lesson.
We hope you continue to enjoy Traders’ Academy!
Hi,
Is there an option to change the chart timezone to the exchange timezone? It is currently set to the local timezone (Singapore) which is UTC+8. However, if I am trading US stocks, I need to convert the time to US time zone.
Thanks
Hello Kevin, thank you for your question. It is possible to change your TWS time zone the moment you log in to TWS: click on More options at the bottom left corner of the TWS login screen, then click on the Time Zone button to choose your TWS time zone and click OK. Then enter your Username and Password and click on Login. Please reach back out with any more questions. We are here to help!
Hi,
Thanks for the reply. Is it the same for IBKR Desktop app?
Thanks
Hello again. Yes, you can change the Time Zone on IBKR Desktop when you log in. Click the “More Options” button in the lower right-hand corner, and “Time Zone” will pop up on the right-hand side of the screen. We hope this helps!
How do I change the candles to match the exchange time? i.e. for New York Time (UTC-5) . I am living outside of US.
Hello Jignesh, thank you for reaching out. To change the time zone for IBKR Desktop, please click “More Options” in the login window. If that does not work, please try to uninstall then reinstall IBKR Desktop. We hope this achieves the result you’re looking for!
In IBKR Desktop App, I tried changing the Timezone to suit the exchange time. However, in IBKR Ao\pp, it does not change the timezone when chart appear on the screen
very good
if i wish to leave drawings (colored lines as examples on the chart how do i save them so they remain with the correct color etc.? I’ve tried to select a line and save as template XYZ but that doesn’t work, How do i save that particular say ES symbol to always have the drawings and even transfer to the next contract at rollover?
Hello, thank you for reaching out. When adding futures market data to a watchlist or trading page, select a continuous futures contract to avoid having to manually roll or re-enter expiring contracts. Please view this User Guide for more instructions: https://www.ibkr.com.hk/en/software/tws/usersguidebook/technicalanalytics/continuous.htm
We hope this helps!
this
is in reference to the new desktop version
Is there a way to either “pop out” the charts, or to relocate them on my computer screens, and save that as the default? I would prefer to view multiple charts at the same time as viewing my entire watchlist with all of its columns?
Hello Chris, thank you for asking. Have you tried out multi-chart mode? You can learn more about it here: https://www.interactivebrokers.com/campus/trading-lessons/ibkr-desktop-sync-multi-chart-mode/
At this point in time you cannot set up multiple charts across multiple monitors, but we are working on a feature that will allow customizing windows which should include what you are requesting. We unfortunately don’t have the ETA.
Hi,
Would like to ask on the IBRK Desktop app, is there any way to set the time zone to “Exchange”. For example, I am currently in Singapore and if I trade D05 the time zone should show (UTC + 8) and if I trade AAPL the time zone should switch to (UTC – 5).
Currently the chart seems to be only able to show one time zone (ie Singapore UTC + 8). If I were to trade different markets, I would need to convert the time manually.
Thanks
Hello Kevin, thank you for reaching out. It is possible to change your time zone on IBKR Desktop from the moment you log in. In the bottom right corner, click More Options> Time Zone. This will allow you to pick any time zone you desire. In the future, please post in the Feature Poll in Client Portal where other IBKR users can comment and vote:
https://portal.interactivebrokers.com/portal/#/suggestions
We appreciate your feedback!
Muy buena lección
Thanks for engaging!
Very good explanations
Thanks for engaging!
I am using multi monitors, how do I detach the chart to move it into other monitor. ?
Hello Ray, thank you for reaching out. In Classic TWS, click the + symbol at the bottom of the screen. Then enter the desired tickers you would like to create a chart for in a watchlist. Then right click each ticker and click “New Chart”. You should be able to drag the two charts to different monitors.
We hope this helps!
Is there a way to change the candles from 30 seconds to 10 seconds? Thanks
We appreciate your question, Manuel. At the top left of the chart is the current time period displayed in the chart, while along the bottom left of the chart is the selected timeframe. You can click on one-month or three-month to change the time frame. And adjust the candle period by clicking on the current value in the upper left to reveal a dropdown containing additional time periods. Note: You may also enable/disable real-time hours by clicking this icon in the top row.
We hope this helps!
unfortunately 30 seconds seems to be the lowest possible, i also tried searching for intervall on the magnifying glass at the right and the lowest i could type in was 30 seconds.
The time periods on my platform screen only show “1d 1m 3m 6m” . There is no 1y and 5y period consistent with the one shown on the Introduction to Charts tutorial. Moreover, when I access the time drop down tab, the sections pertaining to days is muted and therefore inoperable. How may I activate the days section along with adding the 1Y and 5Y periods on the lower left of the screen? Thank you.
Hello, we appreciate your question. The time frame you currently see on the platform is on Advanced Charts in TWS. The 1y and 5y period consistent with the one shown on the Introduction to Charts tutorial is found in IBKR Desktop. IBKR Desktop combines the best of both proven and new technologies. We’ve included many of the most popular tools from our flagship TWS along with a growing suite of original new features like Option Lattice and Screeners with MultiSort. This perfect synthesis of the known and the novel combined with our superior order execution results in a sleek, speedy platform that’s easy to navigate but still packs a punch in the features department. You can download the software here:
https://spr.ly/IBKR_PlatformsCampus
To see real time quotes in a chart, you need to subscribe to real time market data from Client Portal.
https://spr.ly/IBKRMarketDataCampus
Please view this FAQ for more information: https://www.ibkr.com/faq?id=40347241
We hope this helps!
Hi,
In my TWS platform, I have multiple charts from advance charting system, but they seem to be not sync with each other. drawings trendline in one chart not appears in the others. How to fix this issue of sync multiple charts in advance charting.
Hello, thank you for reaching out. At this time, this feature is not available. I have passed your feedback to the appropriate team. Going forward, if you have specific questions or feedback related to Advanced Charts, please email tradingviewsupport@interactivebrokers.com.
When I click on Buy or Sell on ETHEREUM the side panel pop-up but I can’t do anything. Why? Is there a group training session? This is free trial or demo account.
Hello, thank you for reaching out and we apologize for the delayed response. To best answer your question, can you please provide us with more details?
by default, i don’t see any thing that looks like a chart or the nav tools or even a chart at the side bar let alone a full view chart. I downloaded the latest desktop recently. What did I miss?
Hello, thank you for reaching out. You can view a full view chart in IBKR Desktop on the “Quote” screen. This is the bar chart icon with the arrow pointing right above it. If you have specific suggestions and feedback, please submit it directly in IBKR Desktop (speech bubble with thumbs up icon).
We hope that this helps.
How can I set up an alert on IBKR desktop? I do not find the option.
Thank you for asking, Mesbah. Aside from limited message popups in the platform, alerts are not yet available on IBKR Desktop. You can keep up with the latest platform releases here: https://ibkrguides.com/releasenotes/ntws-desktop.htm
Hello, thank you for reaching out. At this time, it is not possible to set up an alert on IBKR Desktop. In the future, please submit specific suggestions and feedback directly in IBKR Desktop (speech bubble with thumbs-up icon). We hope this helps!
IBKR deskstop does not open after the recent update (07.11.2024 at 10.45 am). Please look into this.
Hello, thank you for reaching out. This issue could not be replicated. Please note that currently IBKR Desktop is only supported for Windows (64-bit), macOS with Intel Processor and macOS with Apple Silicon e.g. M1. Please contact Client Services (Technical Assistance) if the issue persists, so we can take a closer look: https://spr.ly/IBKR_ClientServicesCampus
How do I do a factory reset on my charts? I can not get my candles to work. Thanks
Thank you for reaching out. Please view this page from our TWS user guide to select chart parameters, including candlestick and volume selections:
https://www.ibkrguides.com/tws/usersguidebook/technicalanalytics/chart%20parameters.htm
We hope this helps!
IBKR DESKTOP chart not working today after update! Please kindly fix this and don’t delete the comment.
Using the IBKR Desktop app on apple silicon. The charts don’t seem to update live aka “draw”. only when i change to another stock then go back it will update. AKA its like a static snapshot. Not sure why?
Hello, thank you for reaching out. We could not replicate this issue. For a time sensitive trading issue, please contact our Client Services team, which can be reached by phone and live chat.
You can find our available phone support here: https://spr.ly/IBKR_ClientServicesCampus
Thank you for the quality of the content and for starting with the basics for complete beginners.
We hope you continue to enjoy Traders’ Academy!
Do you have I.R.A. Accounts & paper trading
Hello, thank you for reaching out. Yes, you can open an IRA account at IBKR. If you are interested in opening an account: https://spr.ly/OpenAccountfromIBKRForum
You can also transfer an existing IRA account to IBKR. Please view this FAQ for instructions to transfer your IRA to IBKR: https://www.ibkr.com/faq?id=76144770
IBKR offers paper trading. All new accounts automatically have Paper Trading Accounts created for them. https://www.ibkr.com/faq?id=37128282
We hope this helps!
Can we open an investment acct for the new born addition to our family , and what information are you requiring and can it be custodial joint. Pls help us, we need to do this ASAP.
Thx
Hello, thank you for reaching out. Yes, you can set up a custodial account for a child. However, accounts can only be managed by a single user. Please view this FAQ for instructions: https://www.ibkr.com/faq?id=40342299
If you are interested in opening an account, please use this link: https://spr.ly/OpenAccountfromIBKRCampus
Please reach back out with any additional questions. We are here to help!
Could we have 10sec charts on IBKR Desktop?
Hello, thank you for asking. At this time, it is not possible to create a 10s chart on IBKR Desktop. Please send this feedback within the IBKR Desktop platform itself, so it can reach the most appropriate team (speech bubble with thumbs up icon).
However, this is possible in TWS. Please view this FAQ for instructions to change the time period and chart interval for Advanced Charts in TWS: https://www.ibkr.com/faq?id=370330516
We hope this helps!
En la barra de herramientas de dibujo existe una opción “Posición larga”. Cuál es su utilidad?
He posicionado esta heramienta en cualquier punto del gráfico y me indica Objetivos, Apertura PyG y Stops pero no entiendo su fin ya que los límites que marca en verde y rojo no veo que se puedan ajustar; por otro lado me gustría saber si desde ese elemento de dibujo de pueden enviar directamente ordenes combinadas de compra y venta (en el caso de poderse ajustar objrtivos, si ese fuera el fin de ese elemento de dibujo)
Gracias
Gracias por comunicarse con nosotros y le pedimos disculpas por la demora en la respuesta. La herramienta Posición larga permite al usuario establecer un punto de entrada y asumir una posición larga a partir de ese punto. Por encima y por debajo de ese nivel de precio se extenderán dos casillas: verde para la zona de ganancias y rojo para la zona de pérdidas. El usuario puede ajustar manualmente ambas zonas para cambiar la relación riesgo/recompensa. Revise esta página web para obtener más información: https://www.tradingview.com/support/solutions/43000517002-long-position/#:~:text=The%20Long%20Position%20tool%20allows,change%20the%20risk%2Freward%20ratio.
Si tiene alguna pregunta adicional, comuníquese directamente con TradingView para realizar esta consulta. https://www.tradingview.com/support/
I set up a few multi-chart indicator templates, I want to change the indicator template by clicking the name of a saved indicator template, but nothing happens to multi-chart window. How do you use the saved indicator templates?
Thank you for asking. You can change the name of a saved indicator template after it is opened. You can right-click it on the top of the screen to rename the layout, delete the layout, or duplicate the layout. If you change the number of charts or the layout, you must save a new indicator template for it. Please reach back out with any additional questions. We are here to help!
Hi, I have recently opened an IB account and subscribed CME live data. The future prices are live but the accompanying charts are not moving. Who can I check with to find out what’s wrong. Tks
Thank you for reaching out. If you are experiencing issues with charts not updating despite having a live CME data subscription, please try these troubleshooting steps:
Check if the “Keep chart up to date” checkbox is activated in the Chart Parameters panel. This panel can be accessed from the top menu Edit within the chart window.
Ensure you are not logged in on another device with either your live account or paper account. If you are, log off from the other device as this may interfere with your data feed.
Verify that your account balance is above the required threshold for maintaining real-time market data. If your equity has recently dipped below this level, it could affect your data feed.
Try refreshing your market data connection by pressing Ctrl + Alt + F on your keyboard (or Cmd+Option+F on a Mac) while in TWS.
Consider using a Directed Chart instead of a SMART chart. SMART charts can sometimes display incomplete data when there are issues with data synchronization across different exchanges.
If these steps do not resolve the issue, you may need to contact Client Services for additional assistance: https://spr.ly/IBKR_ClientServicesCampus
Hi, is it possible to add a benchmark (e.g. S&P500 index) to a chart in IBKR desktop?
Thank you for asking. Yes, it is possible to add an index to a chart in IBKR Desktop. You can click the plus button in the top left corner and select index. We hope this helps!
For IBKR Desktop, how to replay (Playback) chart candle by candle?
Thank you for reaching out. At this time, this feature is not available. In the future, if you have a specific suggestion(s) on how we can improve, we would like to hear it! Please review this FAQ on where you can leave your feedback:
https://www.ibkr.com/faq?id=32653353
What happen to the home tab on desktop ibkr?
Hello, thank you for reaching out. The standard tabs ae Portfolio, Watchlist, Quote, Screeners, Layouts, and News. These are all easily available on the left hand side of the screen. Please let us know if you have any additional questions. We are here to help!
Hello, How can I enable floating windows in IBKR Desktop? I’d like to view charts on different screens. Thanks!
Hello, thank you for asking. You can right click the Custom Layout and click Detach layout. This will allow you to drag the layout to a different monitor. We hope this helps!
Hello, is IBKR still has the plan to add Level 2 and Time and Sales features to IBKR Desktop? Any plans on release date? Thanks.
Hello, thank you for reaching out. We do not have ETAs, but Time & Sales are on the roadmap for future releases:
https://www.interactivebrokers.com/en/trading/ibkr-desktop.php#pipeline
Would like to add Time & Sales to the layout how can i do this?
Hello Joe, thank you for asking. Please view this FAQ for instructions: https://www.interactivebrokers.com/faq?id=40339120
Hi, in Desktop on the Quote page, I cannot get any Charts for any ticker to display either in Beta or latest version. I’m not sure how to fix this.
Hello, thank you for reaching out and we apologize for the delayed response. We cannot replicate the issue you are experiencing. If you are facing an issue with a particular feature, please submit a web ticket or report the bug in IBKR Desktop (speech bubble with thumbs up icon) so it goes to the development team.
How can we ad Earnings date to charts?
Hello Carole, thank you for contacting us. It is not possible to add the earnings date to charts at this time. We appreciate your feedback and have passed it to the appropriate team. if you have a specific suggestion(s) on how we can improve, we would like to hear it! Please review this FAQ on where you can leave your feedback:https://www.ibkr.com/faq?id=32653353
You can also post in the Feature Poll in Client Portal where other IBKR users can comment and vote:
https://portal.interactivebrokers.com/portal/#/suggestions
We hope this helps!
Ask the dev to add it and also to not forget the splits.
I recently lost all data in all watchlists. Could not find a reason why. I was able to start from the beginning again which entailed adding columns, renaming everything, adding symbols to columns, etc. All is well now but I still do not know how or why the deleting happened. My guess is that I was carrying too many symbols in my watch list 209 vs the 200 allowed. Can you confirm this?? or give me another explanation.
Hello, thank you for reaching out. We are sorry to hear this, and cannot replicate your issue. If you are still experiencing issues, please create a detailed web ticket for Client Services: https://spr.ly/IBKR_ClientServicesCampus
We would appreciate the opportunity to turn around your experience.
I notice that changing the settings of some indicator in the chart of a given symbol, or the setting of a chart itself, modifies all the charts for all the indicators, which makes impossible to customise the chart for a given instrument. Is there a way around this behaviour? Some indicators allow saving a setting template, others don’t.
Hi Ibkr, Is it possible to show floating P & L of the open position on the chart. Really helpiful for scalping. ?
Hi Sandy, thank you for asking. You can show position information on your chart by adding the Quote Zone. Please review the instructions in this FAQ for more information:
https://www.interactivebrokers.com/faq?id=31756383
We hope this helps!
How much candle can see free
Hello, thank you for asking. Yes, you can see candles on charts for free. To get your candles on your chart to show the current time, please view: https://www.interactivebrokers.com/faq?id=31756337
We hope this helps!
Hi, in the IBKR desktop Time & Sales, is there a “last size” filter feature to show only above or below a certain size level please?
Hi Rod, thank you for reaching out. On TWS, there is a “last” feature to filter using Time & Sales. After logging in, right click the desired security and search Time & Sales. There is a “Last” column. We hope this helps!
Hi, On IBKR Desktop, how can I set a 3 hours chart ? And how can I add my personal indicators ? Thank you.
Hi, thank you for asking. After clicking Quote, click the calendar icon. Next to the clock button, you can navigate to the personalized range and input a chart for your desired hours. Also, you can view all the indicators available by clicking the Indicators button. If you have a specific suggestion(s) on how we can improve, we would like to hear it! Please review this FAQ on where you can leave your feedback: https://www.ibkr.com/faq?id=32653353
You can also post in the Feature Poll in Client Portal where other IBKR users can comment and vote: https://portal.interactivebrokers.com/portal/#/suggestions
Hi, On IBKR Desktop, how can I set a 3 hours chart please ? And how can I add my personal indicators ? Thank you.
Hi, Why there is not “snapshot” and “save drawing template as…”icons on IBKR Desktop installed?How can I save drawing on charts?
Hi, thank you for reaching out. There is no way to draw on the charts at this time. However, you can toggle the Auto Save button on in the top right hand corner of the screen in order to save your chart in IBKR Desktop. We hope this helps!
Hi, On IBKR Desktop, how can I view my trade in the chart? I would like to see my entries and exits with an arrow on the chart.
Hi Candela, thank you for reaching out. By default, your Orders and Positions are displayed in the chart. For any specific suggestions, please provide feedback by clicking the thumbs-up button in the bottom left-hand corner. We hope this helps!
Hello, how do I search for bonds on IBKR Desktop?
Hi, thank you for asking. You can enter the ticker of the bond into the watchlist, then click Find underneath “Search by company name and bond issuer”. We hope this helps!
Hi, how to set the default settings for line drawing?
Hi, thank you for asking and we apologize for the delayed response. To save a chart as the default in TWS, please follow the instructions in this FAQ: https://www.interactivebrokers.com/faq?id=64189996
Please reach back out with any additional questions. We are here to help!
Hi, for IBKR Desktop, how do i attached a FX order when placing a Buy order, base currency is USD and placing an order for HKD stock.
Hello, thank you for asking. This is not possible in IBKR Desktop. However, this is possible inTWS. For instructions, please review this FAQ: https://www.interactivebrokers.com/faq?id=51698190
Hello. Are there Advisors to guide the trader into the trades? Thank you.
Hello Sylvia, thank you for reaching out. IBKR does not offer investment advice. Please visit our Investors’ Marketplace to find a professional or service that can help you with your investing needs: https://spr.ly/IBKR_InvestorsMarketplaceCampus
You may also be interested in Interactive Advisors, which can create a diversified, low-cost portfolio personalized for your needs. https://interactiveadvisors.com/asset-allocation
Hello, how can I mark the past transaction records on the chart?
Hi, thank you for asking. Please view this FAQ for instructions: https://www.interactivebrokers.com/faq?id=58443643
We hope this helps!
How to display past entry and exit positions on an IBKR chart
Hi, thank you for asking. Please view this FAQ for instructions: https://www.interactivebrokers.com/faq?id=58443643
We hope this helps!
Seems like I got the wrong desktop application , the one I have is more complicated than the one used in the video tutorial which seems easier to navigate
Hi Mboya, please make sure to download “IBKR Desktop” from this list of platforms: https://spr.ly/IBKR_PlatformsCampus
We hope this is helpful!
Hi Mboya, thank you for reaching out. Please ensure that you have downloaded “IBKR Desktop” from this webpage: https://spr.ly/IBKR_PlatformsCampus
Please let us know if you have any additional questions. We are here to help you!
Chart indicator defaults to bar and candle, instead of line. How do I make line as default?