


Short-term chart indicators can be extremely useful for investors looking for insights into market behavior within a short period of time, anywhere from a few hours to a few days. Interactive Brokers offers two versions of charts on the Trader Workstation (TWS), our standard chart and our advanced chart powered by TradingView. Most indicators are available in both.
Charts can be brought up by going to the New Window area and to the General Tools selecting Charts and then choosing charts or advanced charts.
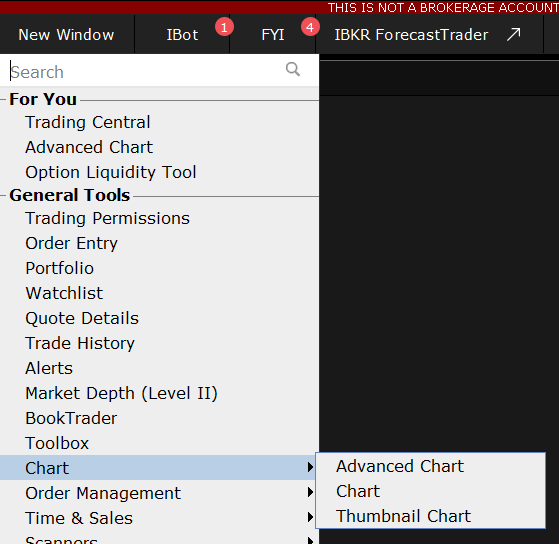
Charts can be brought up as standalone windows or added to a custom layout page along with other IBKR tools or additional charts. In this article the investor is going to use the TWS standard chart. For more information on TWS charts please see the “Getting Started with TWS Charts” lesson and the “Introduction to Charts” trading lesson.
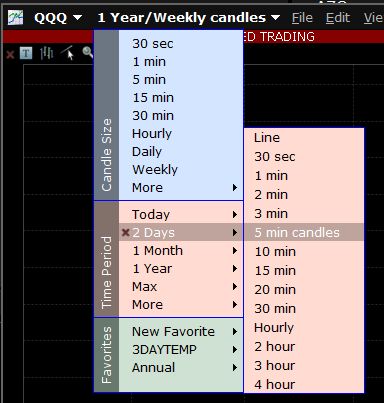
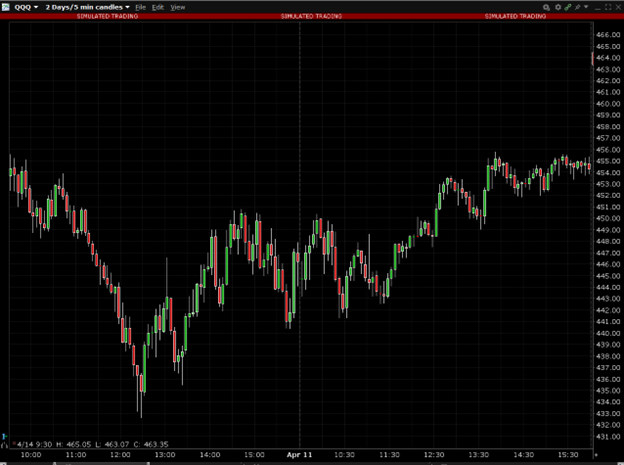
TWS charts and advanced charts allow the investor to see price action at multiple time periods by adjusting the panel in the upper left-hand corner. In the below screen shot the investor is choosing to select a two-day chart with five-minute candles
Studies and indicators are crucial to anyone looking to analyze price data in a chart. In the TWS charts they can be added by going to the Chart Parameters area located under the edit column. In the Chart Parameters area, the investor can not only add studies, but add index comparisons, secondary series, and choose what additional data to show.
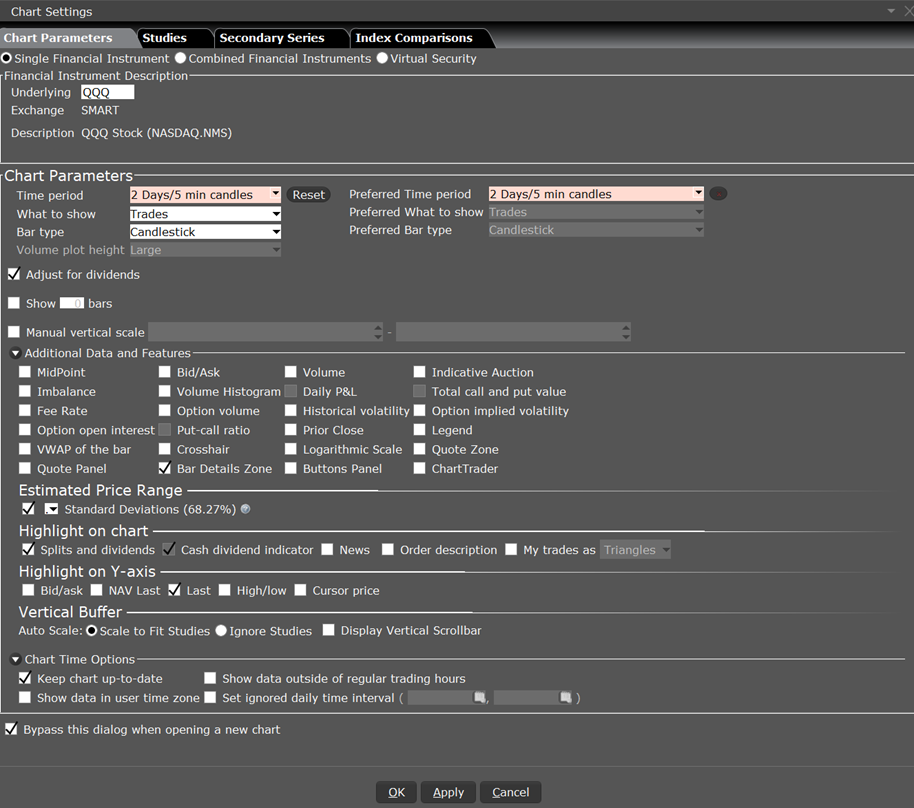
The investor checks off volume under the additional Data and Features area.
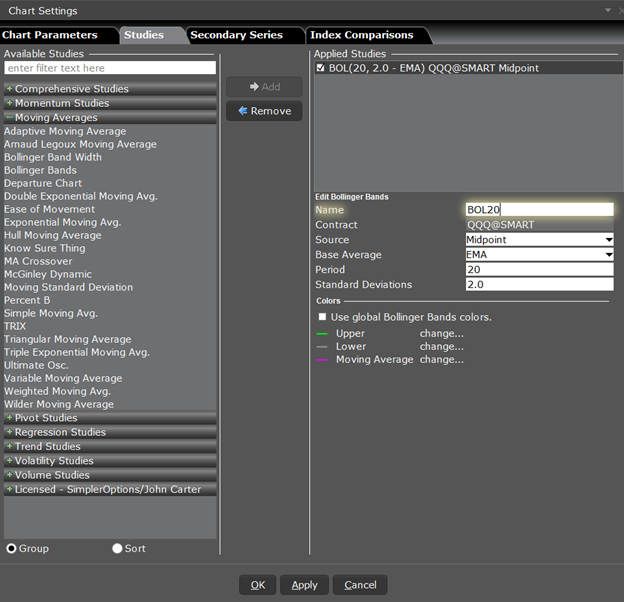
Charts allows the investor to add multiple studies and indicators. The studies and indictors come with default settings that are generally the most common criteria that investors use, but they can be edited for further customization. The investor starts by adding Bollinger Bands by clicking on the “Studies Tab”, expanding the Moving Averages area on the left, selecting “Bollinger Bands”, and clicking the Add button in the center.
Bollinger Bands measure volatility by plotting a series of three bands. The middle band represents the moving average (SMA or WMA or EMA). The upper band is a set number of standard deviations higher than the middle band (generally 2), and the lower band is a set number of standard deviations (generally 2) lower than the middle band. You set the distance of standard deviation when you create the study.
Once added the investor can name the study, choose between trades or midpoint for the source, choose the base average to use. The investor also selects the period to use. In this case they pick Midpoint, EMA, and 20, signifying data from 20 closes will be used. They will also use 2 standard deviations.
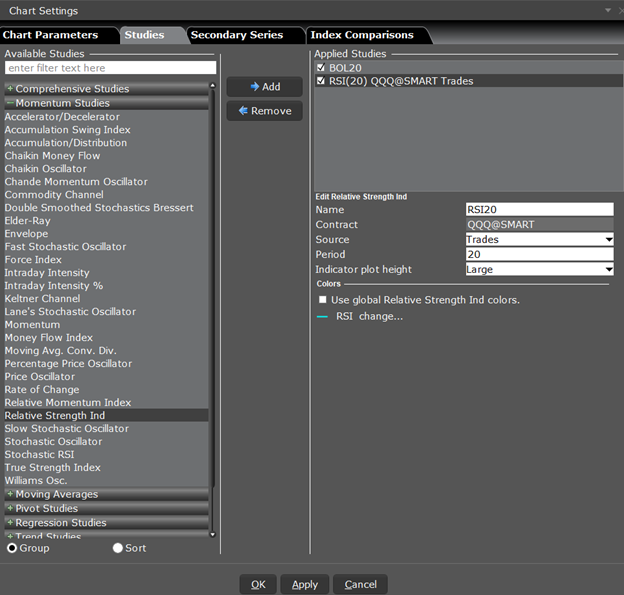
Next, they investor adds a Relative Strength Index or RSI by going to the Momentum Studies area and selecting the appropriate study and walking through similar steps to add and adjust.
The RSI indicator is for overbought/oversold conditions. It goes up when the market is strong, and down when the market is weak, and oscillates between 0 -100. The RSI calculation is:
RSI = 100-(100/1+RS)
Where:
RS – Average of X bars Up Closes/Average X bars Down Closes (X=number of bars set by user)
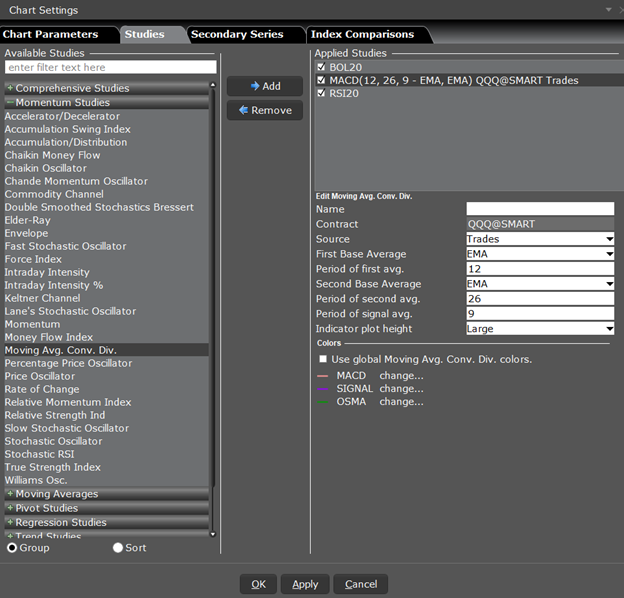
Lastly the investor adds a Moving Average Convergence/Divergence or MACD study, which is also under Momentum Studies. This is a trend-following dynamic indicator that shows the correlation between two moving averages, generally a 26-period and 12-period SMA or WMA or EMA. You can modify the period length when you create the study. To help illustrate opportunity, a 9-period EMA “signal line” is plotted on top of the MACD.
The MACD and signal line are plotted using the following calculations:
MACD = MA (CLOSE, 12)-MA(CLOSE, 26)
SIGNAL = EMA (MACD, 9)
MACD Histogram/OSMA = MACD – SIGNAL
Where:
MA — Simple or Weighted or Exponential Moving Average.
SIGNAL — the signal line of the indicator.
To have the changes take effect the investor clicks Apply, then Ok
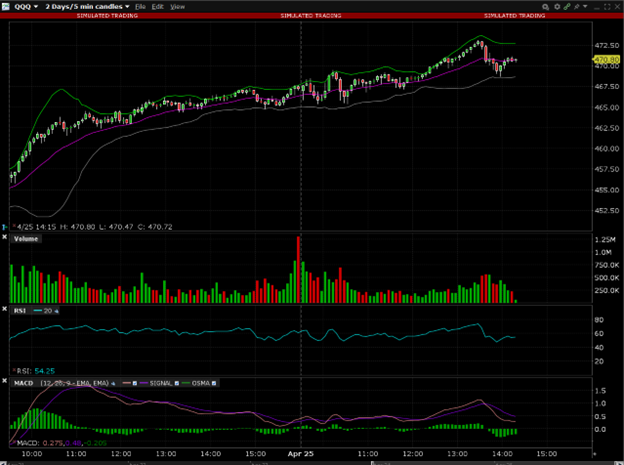
Once the investor has the studies they are interested in on the chart, they can analyze the data and look for trends that they can capitalize on by taking positions in the underlying or options.
Disclosure: Interactive Brokers
The analysis in this material is provided for information only and is not and should not be construed as an offer to sell or the solicitation of an offer to buy any security. To the extent that this material discusses general market activity, industry or sector trends or other broad-based economic or political conditions, it should not be construed as research or investment advice. To the extent that it includes references to specific securities, commodities, currencies, or other instruments, those references do not constitute a recommendation by IBKR to buy, sell or hold such investments. This material does not and is not intended to take into account the particular financial conditions, investment objectives or requirements of individual customers. Before acting on this material, you should consider whether it is suitable for your particular circumstances and, as necessary, seek professional advice.
The views and opinions expressed herein are those of the author and do not necessarily reflect the views of Interactive Brokers, its affiliates, or its employees.


")
Join The Conversation
For specific platform feedback and suggestions, please submit it directly to our team using these instructions.
If you have an account-specific question or concern, please reach out to Client Services.
We encourage you to look through our FAQs before posting. Your question may already be covered!