1/ McClellan Oscillator Signals Potential Pullback
2/ Bearish Divergence Suggests Downside Risk for COST
3/ NKE Gaps Lower on Earnings, But Will It Last?
Investopedia is partnering with CMT Association on this newsletter. The contents of this newsletter are for informational and educational purposes only, however, and do not constitute investing advice. The guest authors, which may sell research to investors, and may trade or hold positions in securities mentioned herein do not represent the views of CMT Association or Investopedia. Please consult a financial advisor for investment recommendations and services.
1/
McClellan Oscillator Signals Potential Pullback
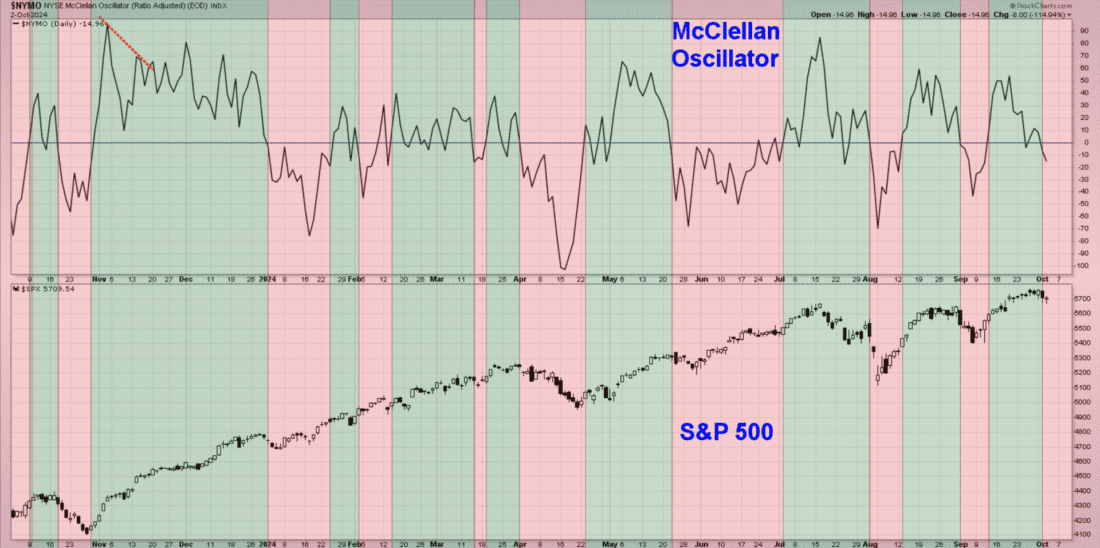
While the long-term breadth picture remains quite constructive, short-term breadth measures have taken a sudden downturn over the last week. I’ve found the McClellan Oscillator to provide an excellent picture of short-term breadth conditions, which can help to anticipate and confirm market pullbacks.
Based on the cumulative advance-decline line for the New York Stock Exchange, the McClellan Oscillator tends to fluctuate around the zero level. When the reading is above zero the short-term breadth is positive, and a reading below zero suggests negative short-term breadth.

Courtesy of StockCharts.com
I’ve shaded this chart of the McClellan Oscillator green and red to highlight when the indicator is above or below the important zero level. I’ve also included the S&P 500 index in the bottom panel for reference. Note how the two most recent market pullbacks in July and September were confirmed by a breakdown in this short-term breadth indicator.
It’s important to note that due to the overweight of the Magnificent 7 stocks and other leading growth names in our benchmarks, the S&P 500 can certainly go higher on weaker breadth as long as those mega cap names remain strong. But generally speaking, signals like the one confirmed this week suggest a pullback for stocks is a much more likely scenario.
2/
Bearish Divergence Suggests Downside Risk for COST
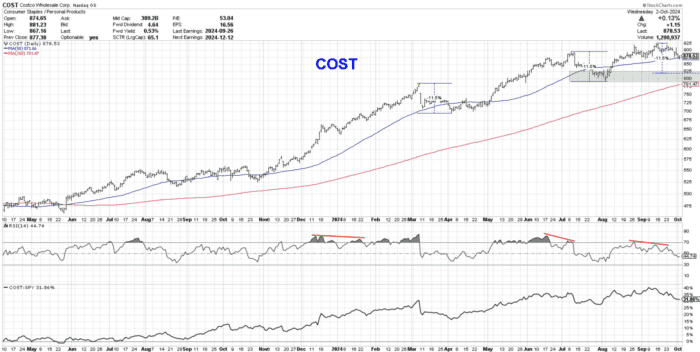
The chart of Costco Wholesale Corp. (COST) has been plagued by the dreaded bearish momentum divergences in 2024. This divergence occurs when price is making higher highs, but a momentum indicator like RSI is trending lower.
This bearish indication often occurs at the end of a bullish phase, when price is still trending higher, but the “buying power” propelling the price higher is beginning to dissipate.

Courtesy of StockCharts.com
Here we can see that COST has experienced two previous bearish divergences in 2024, before the March and July peaks. In both cases, Costco pulled back for about an 11.5% loss before resuming its primary uptrend.
If we would see a similar pullback for COST after the most recent bearish divergence, that would imply a downside target of around $820. It’s worth noting that a pullback of that distance would put Costco down around its August swing low as well as the 200-day moving average. While the long-term trend remains strong, the short-term picture seems less bullish until this divergence can be resolved higher.
3/
NKE Gaps Lower on Earnings, But Will It Last?
Nike Inc. (NKE) dropped about 6.8% on Wednesday after a disappointing earnings call. While this gap lower is certainly not an encouraging sign for investors, the move seemed to confirm the importance of a key resistance level.
The recent swing high for Nike, right around $90, represents a 38.2% retracement of December 2023 to August 2024 downtrend. This price point also line up fairly well with the 200-day moving average, currently sitting around $91.

Courtesy of StockCharts.com
Given that NKE remains above a trendline based on the August and September lows, as well as the 50-day moving average, I’m inclined to treat this chart as “innocent until proven guilty” on the short-term time frame. As long as the price remains above this trendline support, and the RSI holds the 40 level in the coming weeks, this appears to be a brief setup within a larger recovery phase.
From a longer-term perspective, the real issue for Nike is that price remains below a downward-sloping 200-day moving average. Until and unless NKE can regain this long-term trend barometer, investors are better off finding more constructive chart patterns elsewhere.
—
Originally posted 3rd October 2024
Join The Conversation
If you have a general question, it may already be covered in our FAQs. If you have an account-specific question or concern, please reach out to Client Services.
Leave a Reply
Disclosure: Investopedia
Investopedia.com: The comments, opinions and analyses expressed herein are for informational purposes only and should not be considered individual investment advice or recommendations to invest in any security or to adopt any investment strategy. While we believe the information provided herein is reliable, we do not warrant its accuracy or completeness. The views and strategies described on our content may not be suitable for all investors. Because market and economic conditions are subject to rapid change, all comments, opinions and analyses contained within our content are rendered as of the date of the posting and may change without notice. The material is not intended as a complete analysis of every material fact regarding any country, region, market, industry, investment or strategy. This information is intended for US residents only.
Disclosure: Interactive Brokers
Information posted on IBKR Campus that is provided by third-parties does NOT constitute a recommendation that you should contract for the services of that third party. Third-party participants who contribute to IBKR Campus are independent of Interactive Brokers and Interactive Brokers does not make any representations or warranties concerning the services offered, their past or future performance, or the accuracy of the information provided by the third party. Past performance is no guarantee of future results.
This material is from Investopedia and is being posted with its permission. The views expressed in this material are solely those of the author and/or Investopedia and Interactive Brokers is not endorsing or recommending any investment or trading discussed in the material. This material is not and should not be construed as an offer to buy or sell any security. It should not be construed as research or investment advice or a recommendation to buy, sell or hold any security or commodity. This material does not and is not intended to take into account the particular financial conditions, investment objectives or requirements of individual customers. Before acting on this material, you should consider whether it is suitable for your particular circumstances and, as necessary, seek professional advice.
Disclosure: ETFs
Any discussion or mention of an ETF is not to be construed as recommendation, promotion or solicitation. All investors should review and consider associated investment risks, charges and expenses of the investment company or fund prior to investing. Before acting on this material, you should consider whether it is suitable for your particular circumstances and, as necessary, seek professional advice.


In addition to considering McClellan below zero, ‘mid-east’ war / tensions are in play now, & I think, send the opposite message. Also, major indexes, DIA, QQQ, SPY, etc., appear to have reversed recent downward direction. Perhaps only a single Mag 7 (META) is overbought. The others appear to be doing just fine & in an upward direction, including TSLA bull flag.