(Today’s theme song is not my favorite from the Queen of Soul, but it fits)
Sometimes we have to struggle to look for a narrative about what is propelling indices in one direction or another. Lately, it is strikingly obvious that Nvidia (NVDA) is the equity market’s turbocharger. I’m frequently asked, “when and how might this 1999-style rally come to an end? The most likely date is February 22nd, and the how and why is NVDA earnings.
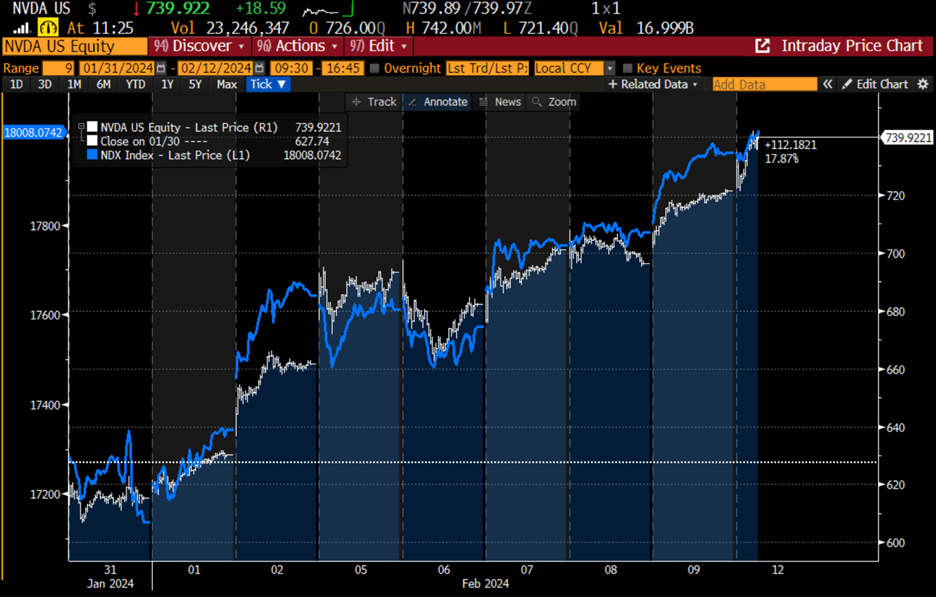
Since a picture tells a thousand words, take a look at this one, which compares NVDA to the NASDAQ 100 Index (NDX) since January 31st:

Source: Bloomberg
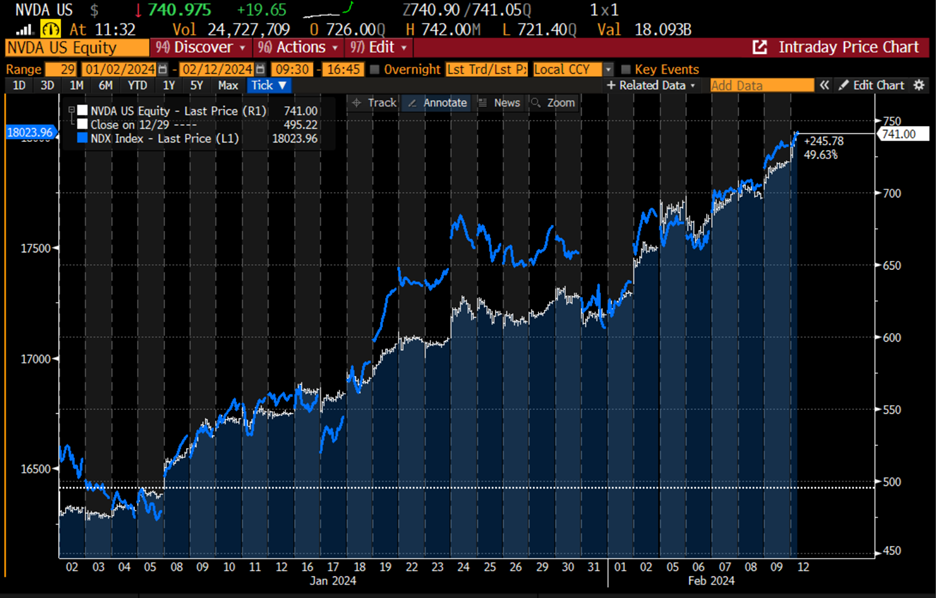
And here is the same chart on a year-to-date basis:
Chart Since January 2nd, 2024: NVDA (white bars) vs. NDX (blue line)

Source: Bloomberg
To be fair, some of the other “Magnificent 7” stocks correlate rather well with NDX over that time period. So does Broadcom (AVGO), the stock that I nominated to replace Tesla in the “Mag 7” three weeks ago. But none do it as almost perfectly as NVDA.
(A quick side note about TSLA and the Mag 7: One of the most discussed stories this morning is an article that suggests that investors are wondering if TSLA is still magnificent. As noted above, I haven’t been wondering this for the last three weeks, since I wrote a piece entitled “Magnificent Seven May Need a Roster Change,” which was published ahead of TSLA’s most recent earnings report. Sorry for the angry digression…)
I put forth those charts because they illustrate the outsized role that NVDA has in the market’s mindset. It is certainly among the most, if not THE most, talked-about stocks today. The lofty expectations that are placed upon its growth and revenues are a key driver to the bullishness surrounding artificial intelligence and play a major role in the overall expectations for top and bottom-line growth this year. And it has displaced TSLA as the perpetual volume leader among IBKR customers. The stock is a juggernaut!
Yet therein lies a key risk for equity markets as a whole, with that risk culminating just over a week from today when NVDA reports earnings after the close of February 21st.
Let me be clear – I have no special insight into the actual numbers that NVDA is likely to report. I’ll accept the published consensus of $4.53 EPS on about $20.2 billion revenues for 4Q ’23 and Q1 guidance of $4.80 on $21.4 bn. Instead, I’ll focus on the risks embodied in a stock that is up 45% YTD – and the year is only 6 weeks old!
It is clear that market expectations either for Q4 results or forward guidance are well above those embodied by analysts. If the market was satisfied with analysts’ expectations, we wouldn’t see this stock rocketing higher. That means that there is tremendous room for disappointment. Considering NVDA’s index weights and psychological importance, a sell-off in that stock would indeed impact the indices
Bear in mind that NVDA fell slightly after its last report despite reporting blowout numbers. This is not an idle concern. Consider that GOOG beat on both its top and bottom lines yet fell about 6% after earnings because it missed on search ad revenue by a hair. Consider also that MSFT fell despite also beating on the top and bottom lines because of vague concerns about Azure.
Further adding to concerns about the fragility of NVDA’s rocket ship ride is a feedback loop that Thomas Peterffy alluded to in a recent CNBC interview: our customers have been writing calls against stocks like NVDA, only to find that the rapid upward moves are leaving them exposed to getting their stocks called away, which would then expose them to significant capital gains taxes. In turn, they find themselves buying back their calls at a loss that is less than the taxes, but that adds further fuel to the buying. An earnings disappointment would break that cycle.
Thus, what should an investor do? One idea would be to consider protective puts on QQQ or SPY expiring on 2/23 or later, which are relatively inexpensive by historical standards. One could consider puts on NVDA, but those are both expensive and very much a moving target (as would be any hedge at this point). Of course, those investors who have long-term, rather than short-term, gains on NVDA can indeed hedge their positions by writing calls against their position. Remember, no one ever went broke taking a profit!
Join The Conversation
If you have a general question, it may already be covered in our FAQs. If you have an account-specific question or concern, please reach out to Client Services.
Leave a Reply
Disclosure: Interactive Brokers
The analysis in this material is provided for information only and is not and should not be construed as an offer to sell or the solicitation of an offer to buy any security. To the extent that this material discusses general market activity, industry or sector trends or other broad-based economic or political conditions, it should not be construed as research or investment advice. To the extent that it includes references to specific securities, commodities, currencies, or other instruments, those references do not constitute a recommendation by IBKR to buy, sell or hold such investments. This material does not and is not intended to take into account the particular financial conditions, investment objectives or requirements of individual customers. Before acting on this material, you should consider whether it is suitable for your particular circumstances and, as necessary, seek professional advice.
The views and opinions expressed herein are those of the author and do not necessarily reflect the views of Interactive Brokers, its affiliates, or its employees.
Disclosure: Options Trading
Options involve risk and are not suitable for all investors. Multiple leg strategies, including spreads, will incur multiple commission charges. For more information read the "Characteristics and Risks of Standardized Options" also known as the options disclosure document (ODD) or visit ibkr.com/occ
Disclosure: ETFs
Any discussion or mention of an ETF is not to be construed as recommendation, promotion or solicitation. All investors should review and consider associated investment risks, charges and expenses of the investment company or fund prior to investing. Before acting on this material, you should consider whether it is suitable for your particular circumstances and, as necessary, seek professional advice.


what a great insight
Thanks for engaging!
I’ve held Nvidia for over 20 years. Sure it’s already had over exuberant investors before, and tanked for a bit. several times actually. But my original stake of $35,000 is now worth $5,600,000. You never lose, if you don’t sell….