


| Market Scanner | Spot trends, view exchange specific data and filter for the criteria you specify. A dynamic page is generated for the top 50 tickers that meet your criteria and updates every 60 seconds. |
| Fundamentals | Market Watch - Fundamental analytics, powered by Market Watch with company profiles, financials, historical charts, and more. Reuter's - Comprehensive fundamental market data on more than 46,000 companies on over 100 exchanges around the globe is seamlessly integrated into TWS. A monthly subscription gives you data viewable in TWS and through the socket APIs. |
| Charts | Scalable, customizable, stand alone window with line, bar and candlestick charts for up to 3 years of historical data. Monitor multiple charts simultaneously, add indicators, studies, trend lines, even manage your trades in a real-time chart while monitoring dynamic price movements. |
| News | Get the latest stories and headlines delivered to your trading window via Reuters, Google, Yahoo! and other RSS financial news feeds. |
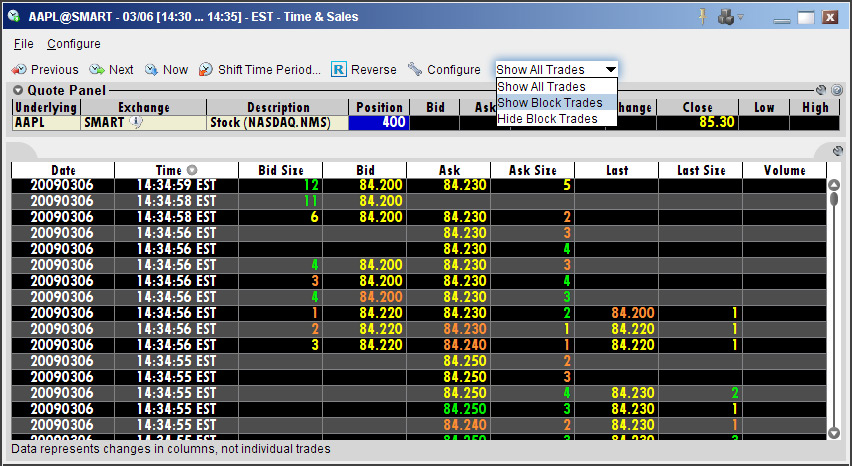
| Time & Sales | Displays time & sales for the selected contract. |
| Trader Dashboard | Show or hide the customizable Trader Dashboard panel to display at-a-glance account or symbol data. |
| Market Depth | Displays the alternative bids and offers away from the inside quote to allow you to better gauge market liquidity. |
| Alerts | Send pop-up message to the trading screen, an email or a text message to your cell phone. Alerts can also trigger a pre-defined order based on market movement or even the state of your margin cushion. |
Market Scanners
The Market Scanner automatically populates a pre-formatted trading page with related market data for stocks, bonds, futures and indexes based on specified criteria. View Advances and Declines, Uptick, Down tick volumes. Create scanners for the Top% Gainers, Most Active, Hot Contracts by Volume, plus many, many more. Use the scanners to help spot trends, view exchange specific data and filter for the criteria you specify. A dynamic page is generated for the top 50 tickers that meet criteria you specify with updates every 60 seconds.
The data used in IB’s daily commentary, the Options & Futures Intelligence Report is available to TWS users in the Market Scanners feature, and includes statistics for the top issues regarding: implied volatility, volatility gainers, options volumes, options volume gainers, implied/historical volatilities, put/call ratios, and call/put ratios.
Set Scanner Parameters
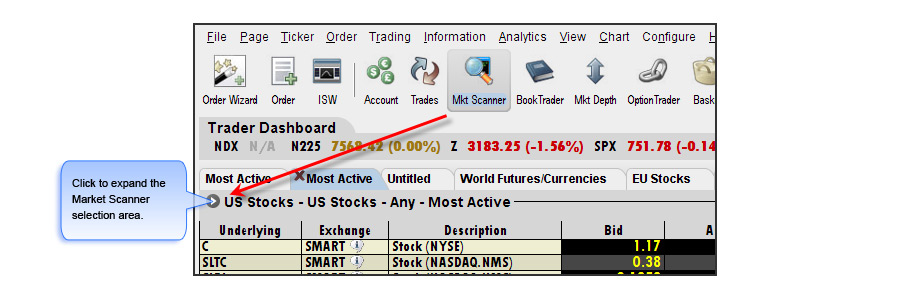
- Click the Market Scanner icon to open a new page.
- Use the panel arrowhead to expand/collapse the Scanner Selection panel.
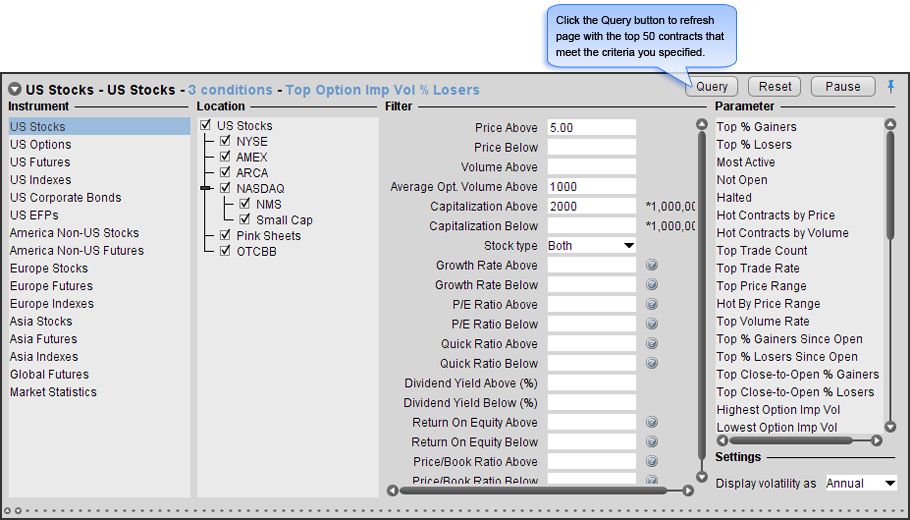
- Work from left to right to activate context sensitive selections based on choices indicated.
- Choose an Instrument to drive the selections available.
- Filter by location if desired.
- Enter any desired filtering criteria – A subscription to Reuters Fundamentals enables additional fundamental filters based on top ratio.
- Choose a scan to run from the Parameter list.
- Click the Query button to display the top 50 tickers that met your criteria.
Market Statistics
- Advancing Issues, Declining Issues and Unchanged Issues.
- Up Volume, Down Volume and Unchanged Volume.
- TICK – The Tick Index indicator shows the number of stocks trading on an up tick minus the number of stocks trading on a downtick.
- TRIN – The TRIN (Trader's Index) indicator is a technical analysis indicator calculated by dividing the advances-to-declines spread by the volume of advances to declines.
Open multiple scanner windows by simply selecting the Market Scanner icon for a new window. Select an Instrument and the parameters that are specific to the instrument are enabled.
- To view scans for option values, use Stocks as the instrument.
- Right click functions allow access to
- Contract Info, Details to easily identify unfamiliar symbols.
- Tools such as OptionTrader and SpreadTrader.
- Analysis features such as Real-time Charts and Company Profiles.
- Spreadsheet format lends allows easy re-sort by clicking column header
(first click ascending, second click descending, third click is back to original sort) - Right click Change column header to toggle between % change or actual change in price.
- Yellow bar across the top of the market scanner window is a warning, that requested information is not available. Change parameters or re-try during market hours.
- Remember to click Query Button to refresh scanner with requested data. Button remains grayed out until scanner parameters are changed. If button is active, it’s a signal to click on it.
TWS Fundamentals
Fundamental Market analysis allows you to research the value of a stock by examining the financial data that is 'fundamental' to the company, taking into consideration variables related to the company, such as its earnings, dividends, sales, operations and financial condition.
TWS provides two choices:
- MarketWatch available to all in TWS for US equities.
- Reuter’s Fundamental available with additional subscription and provides fundamental data on 46,000 global tickers.
Market Watch
Available for US Equities A simple right click gives you access to essential fundamental factors and company specific events. Powered by MarketWatch financial information, company fundamentals are intuitively organized with links that let you drill down for additional information by company, industry, report type or corporate event.
Right click on a ticker and select from
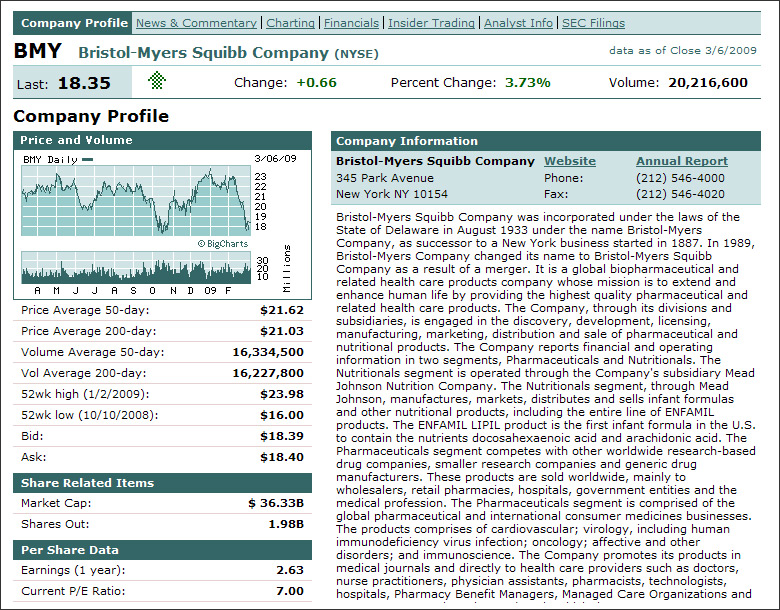
- Company Profile - basic data such as industry, contact information, product/services offerings and per share and profitability data and valuation ratios for the selected asset.
- News and Commentary - contract-specific headlines and press releases.
- Historical Charts - to view historical trading patterns that occur around corporate events such as earnings and dividend announcements. Analyze volume by price, add multiple moving averages, compare to a select index, and even quickly change the time period viewed from one day to a decade or longer.
- Company Financials, Income Statement, Balance Sheet and Cash Flow Statement, quarterly or annual financials for the previous 4 periods.
- Insider Trading Information – with the last ten insiders trading actions for the selected underlying.
- Analyst Information– most recent analyst recommendations for the contract.
- SEC Filings View for the past year.
Thomson Reuters Worldwide Fundamentals
A premier provider of comprehensive financial information on thousands of companies around the globe has been seamlessly integrated into the TWS platform:
- Information at your fingertips – accessible in TWS from multiple areas including trading fields, market scanners and company specific report pages.
- Global fundamental data for over 46,000 companies on more than 100 exchanges in over 70 countries.
- Data includes estimates on book value, per share and growth data, capital expenditure and revenue per share, with access to income, balance sheet and cash flow statements.
- Access is supported through both the socket APIs and TWS.
- Export Fundamentals data to a spreadsheet via the API, or cut and paste directly from the TWS window.
Fundamental information can be viewed from a ticker row, or create a ticker specific page for more in-depth reports.
- IB customers must first subscribe to this service via Account Management to receive Reuters Fundamentals market data directly in TWS.
- Enable Fundamentals in the Feature Selector to activate the toolbar icon.
- Use Market Scanners to locate the top 50 companies based on key fundamental ratios and other parameters you set.
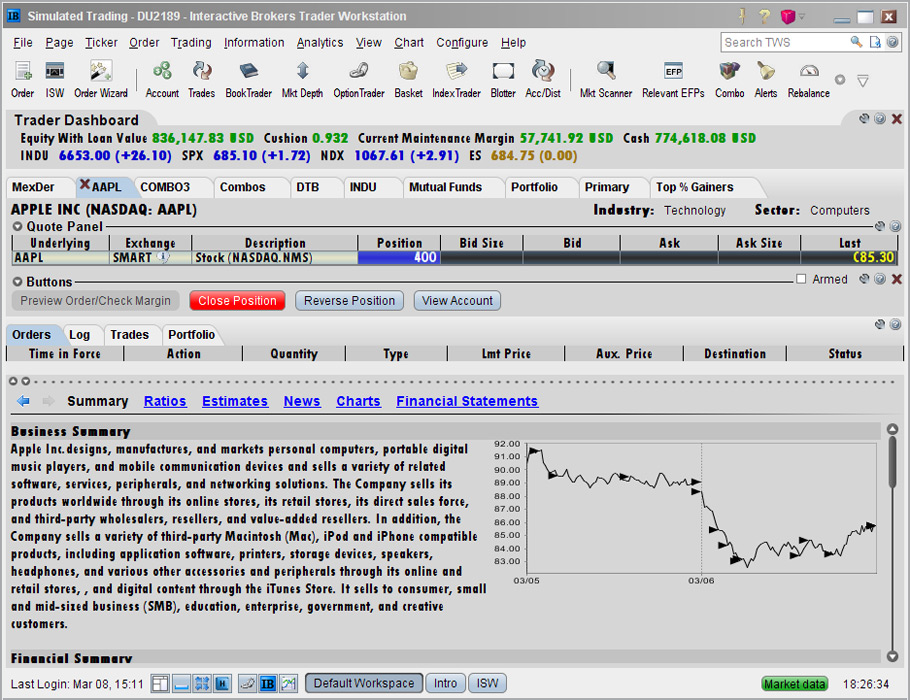
- The Summary page displays a two-day chart, and a new Charts links has been added to the list of available data, along with Summary, Ratios, Estimates, News and Financial Statements.
Trading Page
Key Fundamental ratios are easily accessible in the ticker row Description box (double click) or customize the trading page with fundamental ratio fields added to your ticker quote line.
Description field
Fundamentals are displayed in the right pane when the Description box is expanded.
- Double click the Description field of a ticker quote line.
- Or Right click a ticker line and select Contract Info, then Description.
- Hover mouse over question mark icon for a definition of its associated value.
Trading page layout
Add key fundamental ratios in ticker row – from the Right Click menu, choose Customize Layout, and expand the Fundamentals Group to select from these fields. Quickly sort and re-sort any of your ticker lists based on the fundamental fields with just a click on the column headers. (first click sorts in ascending order, second click sorts descending order, third click back to original sort).
Market Scanners
The Market Scanners list several Fundamental parameters to show you the top 50 highest or lowest performers based on growth rate, P/E ratio, or dividend yield. Filter criteria can also be set.
Fundamentals Reports Icon
Comprehensive full-page data reports either added as a new trading page or used as a separate trading module, provides current market quotes and complete order management and now displays a two-day chart, along with Summary, Ratios, Estimates, News and Financial Statements. Charts are available for time periods of 1 week to 3 years.
- You can find ratios, earnings information, expenditures and more in the Summary, Ratios, Estimates, News, and Financial Statements reports.
- Click a report category to open the reports page. Notice that several of the reports include sub-reports listed across the top of the report page.
- To see the definition and calculation for a field, hover your mouse over the "information" icon.
- Access company financials, in a standardized format for easy comparison.
Ratios
- Financial ratios are used to gain an idea of a company's valuation and performance with the figures from the financial statements.
- Here you can look at several valuation methods, factoring in price/earnings ratio, PEG, dividend yields, book value, price/sales ratio, and return on equity.
- Each valuation ratio uses different measures in its calculations; time interval for each ratio is indicated:
- TTM = trailing twelve months.
- MRQ = most recent quarter.
- MRY = most recent year.
Estimates
- See earnings estimates including per share book value, prior year's earnings estimate, and estimated earnings growth rate for the selected underlying.
News
- Add pre-configured news feeds from sources like CNET News, Google News, MSNBC and Reuters using the News features to your workstation.
- If Reuters New selection is grayed-out, it means that you must first subscribe to Reuters News Service via the Market Data subscriptions page in Account Management.
Financials
Standardized view of financials in a Company Specific view, for previous four periods:
- Income Statement
- Balance Sheet
- Cash Flow
Time & Sales
You can elect to view the Time & Sales for any underlying from the trading screen or from within a chart.
Trader Dashboard
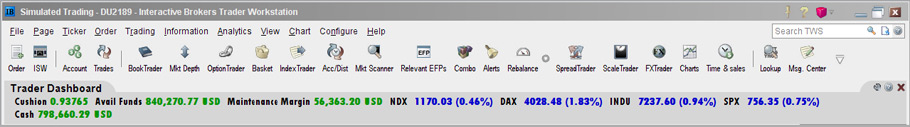
Trader Dashboard is a customizable panel for the top of your trading pages. This panel lets you monitor real-time account values with select data fields from the Account window. So you can quickly determine if the account has sufficient funds to put on a trade or if you are approaching margin limits. You can also keep current with market movement for selected tickers/indexes. If not enabled, you can turn on the Trader Dashboard from the Information Tools menu.
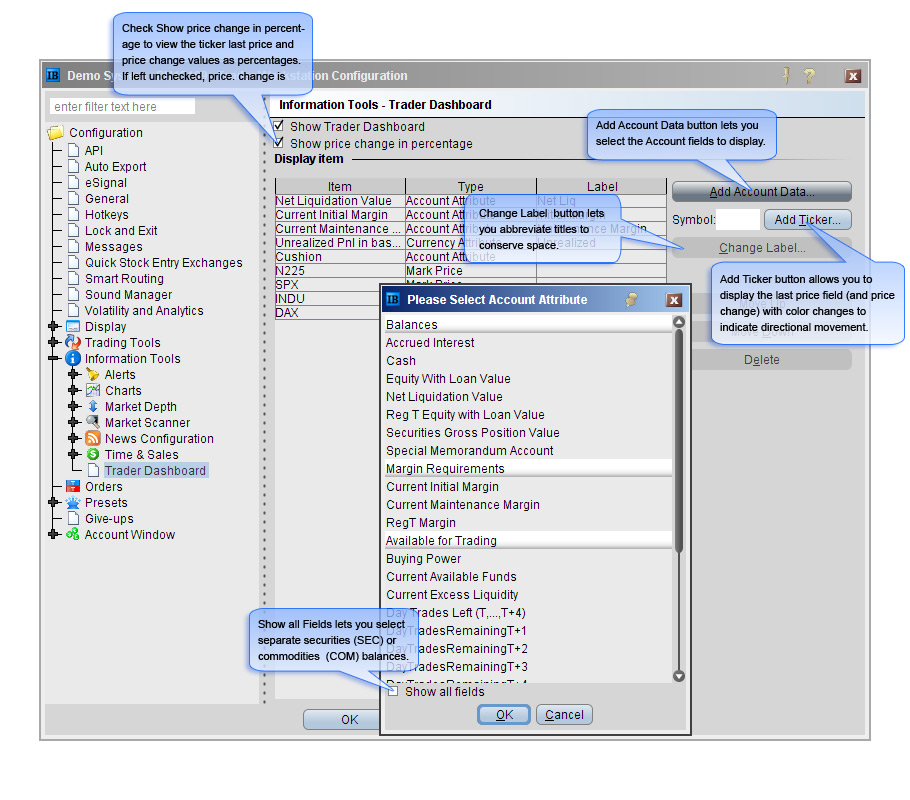
Use the configure wrench to add account values or tickers to the Dashboard.
- Add Account Data button lets you select the Account fields to display.
- Cushion field shows the percent of available margin and lets you know when approaching margin deficiencies – this allows you to consider margin reducing trades before facing a liquidation.
- Change Label button lets you abbreviate titles to conserve space.
- Show all Fields lets you select separate securities or commodities balances.
- Add Ticker button allows you to display the last price field (and price change) with color changes to indicate directional movement.
- Check Show price change in percentage to view the ticker last price and price change values as percentages. If left unchecked, price change is displayed in absolute value.
Market Depth
Market Depth feature of TWS displays trading volume and the bids and offers away from the inside quote to gauge market liquidity.
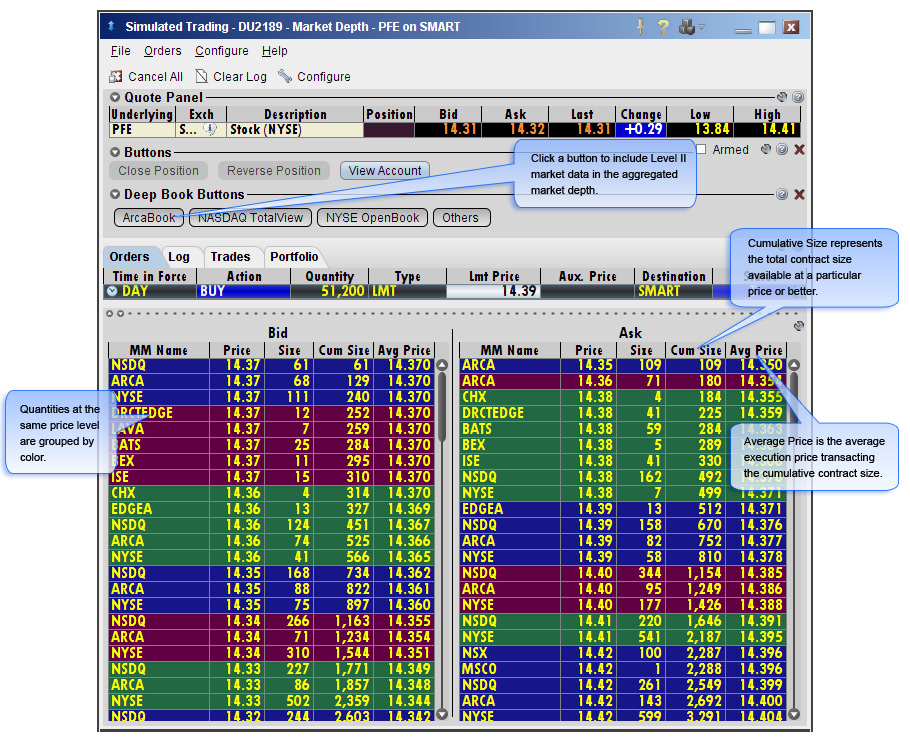
- Smart Market Depth window aggregates and displays the best bids and offers available from all markets for the product.
- Access to Level II data for NASDAQ stocks and NYSE Deep Book for NYSE-listed stocks by subscription. (upgrade through Account Management market data subscriptions).
- Add or remove Level II data using the Deep Book Buttons. The Others button displays Level I data from exchanges that don’t offer deep data.
- Cumulative size represents the total contract size available at a particular price or better.
- Average Price is the average execution price transacting the cumulative contract size.
- Open up to 3 Market Depth windows simultaneously.
- Market maker designed, this component also facilitates large volume trades using cumulative quantities and average execution price available at a particular price or better.
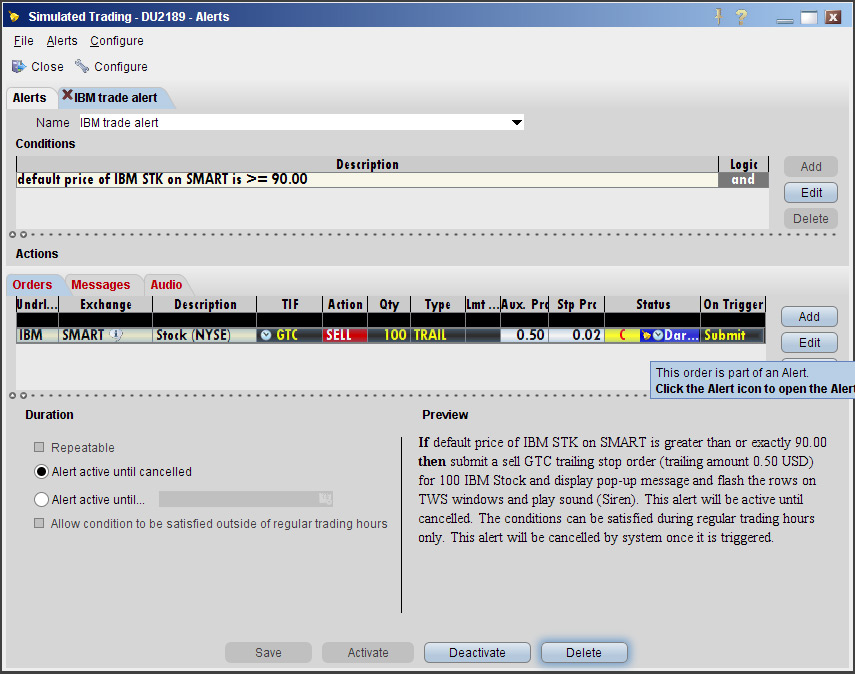
Alerts
Create alerts using real time market data and/or account values.
- Define Conditions to activate an alert and the Actions to occur when those conditions are met.
- Alerts can be based on price movement, time and date, trading volume or the state of your margin cushion.
- Alerts send a pop-up message to your trading screen, an email message or a text message to your cell phone.
- Alerts can also trigger a pre-defined buy or sell order.
News
You can elect to add pre-configured news feeds from sources like CNET News, Google News, MSNBC and Reuters using the News features to your workstation.
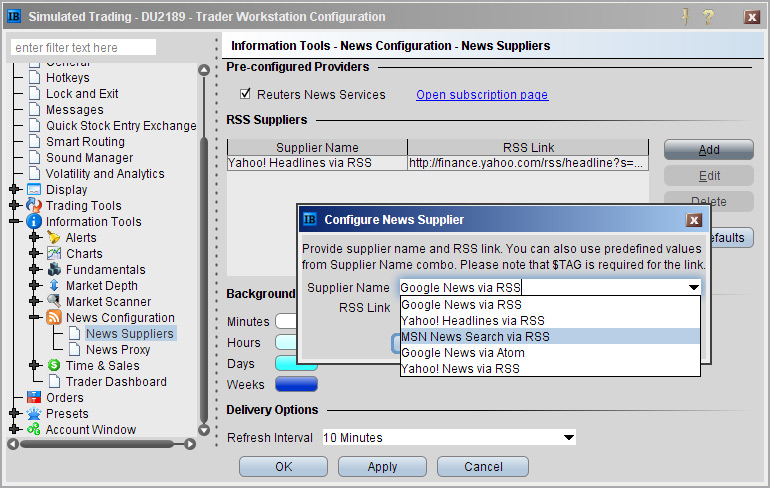
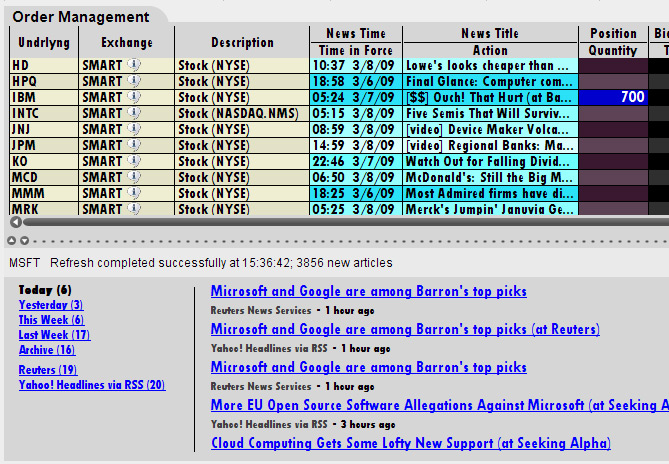
If Reuters New selection is grayed-out, it means to access that you must first subscribe to Reuters News Service via the Market Data subscriptions page in Account Management. News Time and News Title fields can be added to the quote line. Background shading indicates how long the story has been out; stories with the lightest color are the most recent.
Click a news title to open the News browser directly below the Trading window.
- Single left click in a news field to opens the news panel at the bottom of trading window.
- Double left click in a news field to open the story in a new browser window.
Charts, when Show News is enabled, also display flags when stories appear, with a separate window to access the actual story. Hover the cursor over the chart flag for headline with access to stories. With the Reuter’s News subscription you can create Fundamental pages, that display ticker specific headlines with the trader tool layout that allows complete order management from a Fundamental page.


