Machine learning logistic regression is a widely popular method to model credit. There are excellent and efficient packages in R that can perform these types of analysis. Typically, you will first create different machine learning visualizations before you perform the machine learning logistic regression analysis.
Visit DataScience+ Blog to read the Introduction to Credit Modelling in this article. The post here will continue with Credit Modelling in R and the sample R code.
Now let us start using R for Credit Modelling. The first thing we need to do is to load the R packages into the library. (To download the R code visit the author’s blog here: https://datascienceplus.com/machine-learning-logistic-regression-for-credit-modelling-in-r/)
#Load R packages into the library
#Data management packages
library(DescTools)
library(skimr)
library(plyr)
library(dplyr)
library(aod)
library(readxl)
#Visualization packages
library(Deducer)
library(ggplot2)
#Machine learnning method packages
library(ROCR)
library(pROC)
library(caret)
library(MASS)
Now it is time to load the dataset and do some data management. We will work with the loan lending club dataset. The below coding is the data management:
#Import dataset
loan_data <- read.csv(“/loan.csv”)
#Selecting the relevant variables in the dataset:
loan_data <- loan_data[,c(“grade”,”sub_grade”,”term”,”loan_amnt”,”issue_d”,”loan_status”,”emp_length”,
“home_ownership”, “annual_inc”,”verification_status”,”purpose”,”dti”,
“delinq_2yrs”,”addr_state”,”int_rate”, “inq_last_6mths”,”mths_since_last_delinq”,
“mths_since_last_record”,”open_acc”,”pub_rec”,”revol_bal”,”revol_util”,”total_acc”)]
#Data management for missing observations
loan_data$mths_since_last_delinq[is.na(loan_data$mths_since_last_delinq)] <- 0
loan_data$mths_since_last_record[is.na(loan_data$mths_since_last_record)] <- 0
var.has.na <- lapply(loan_data, function(x){any(is.na(x))})
num_na <- which( var.has.na == TRUE )
per_na <- num_na/dim(loan_data)[1]
loan_data <- loan_data[complete.cases(loan_data),]
Although this is the second step of a credit modelling analysis, the visualization step can be found in my previous article. The below code is the visualization:
#Visualization of the data
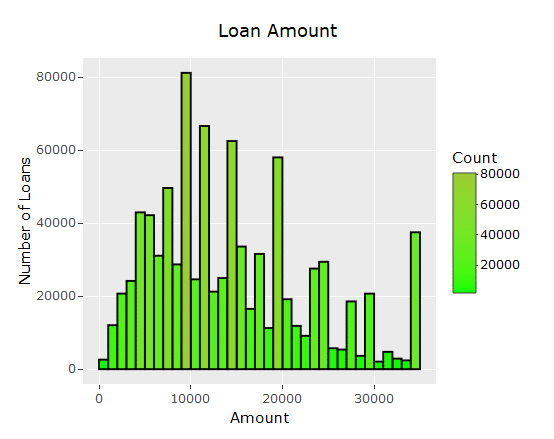
#Bar chart of the loan amount
loanamount_barchart <- ggplot(data=loan_data, aes(loan_data$loan_amnt)) +
geom_histogram(breaks=seq(0, 35000, by=1000),
col=”black”, aes(fill=..count..)) +
scale_fill_gradient(“Count”, low=”green1″, high=”yellowgreen”)+
labs(title=”Loan Amount”, x=”Amount”, y=”Number of Loans”)
loanamount_barchart
ggplotly(p = ggplot2::last_plot())
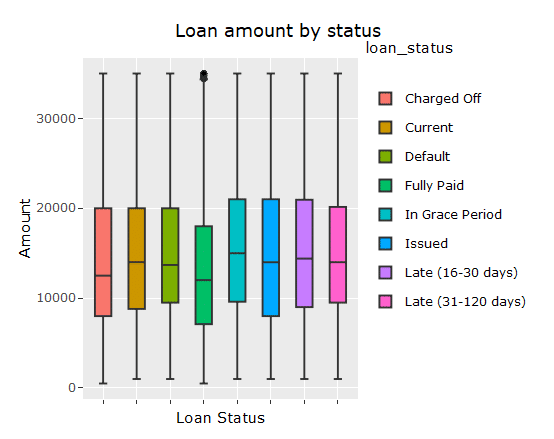
#Box plot of loan amount
box_plot_stat <- ggplot(loan_data, aes(loan_status, loan_amnt))
box_plot_stat + geom_boxplot(aes(fill = loan_status)) +
theme(axis.text.x = element_blank()) +
labs(list(title = “Loan amount by status”, x = “Loan Status”, y = “Amount”))
ggplotly(p = ggplot2::last_plot())
The above coding gives us the following two visualizations:
To see some descriptive statistics of the data, see the full article here:
https://datascienceplus.com/machine-learning-logistic-regression-for-credit-modelling-in-r/
About the Author:
Kristian Larsen is a passionate economic data scientist with an expertise in R, Excel, VBA, SQL, STATA, SAS and Python. He creates Automated dashboards, business intelligence, machine learning, data analysis, AI, deep learning, data management, statistical analysis and programming.
Disclosure: Interactive Brokers
Information posted on IBKR Campus that is provided by third-parties does NOT constitute a recommendation that you should contract for the services of that third party. Third-party participants who contribute to IBKR Campus are independent of Interactive Brokers and Interactive Brokers does not make any representations or warranties concerning the services offered, their past or future performance, or the accuracy of the information provided by the third party. Past performance is no guarantee of future results.
This material is from DataScience+ and is being posted with its permission. The views expressed in this material are solely those of the author and/or DataScience+ and Interactive Brokers is not endorsing or recommending any investment or trading discussed in the material. This material is not and should not be construed as an offer to buy or sell any security. It should not be construed as research or investment advice or a recommendation to buy, sell or hold any security or commodity. This material does not and is not intended to take into account the particular financial conditions, investment objectives or requirements of individual customers. Before acting on this material, you should consider whether it is suitable for your particular circumstances and, as necessary, seek professional advice.







Join The Conversation
If you have a general question, it may already be covered in our FAQs. If you have an account-specific question or concern, please reach out to Client Services.